Asia’s Energy Transition: Pakistan

Asia’s Energy Transition: Pakistan

This is the first of a series on the energy transition in Asia’s largest economies. Asia is the most important global market for energy consumption, investment, and greenhouse-gas emissions. Asia is also a region in the midst of a large-scale energy transition, whose pattern and evolution remains to be determined. How this energy transition evolves has more importance to the future of climate change, and to the future of energy investments, than that of any other region. Infrastructure Ideas will focus in turn on the state-of-play in this transition in several of Asia’s big economies, starting with Pakistan.

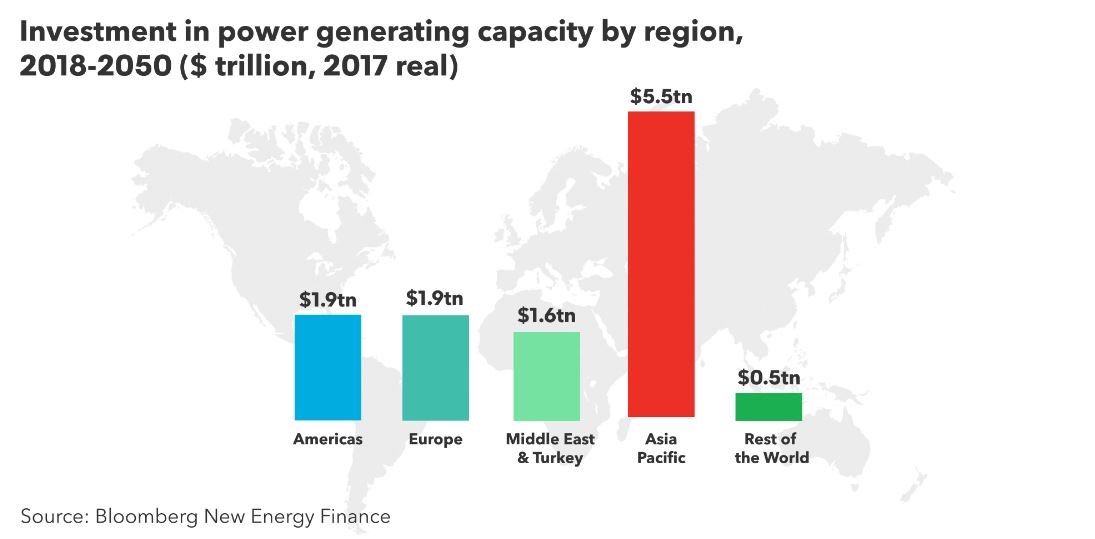
A few numbers illustrate the importance of Asia in the energy world. Between economic growth and connecting the underserved (just under 500 million of the 1 million people without access to reliable electricity are in Asia), the region dwarfs all others in expected energy consumption growth. Bloomberg New Energy Finance projects that, in Asia, over $5 trillion will be invested in power generation capacity from now to 2050, over $180 billion per annum. Asia is expected to account for nearly 50% of all such investment globally.

Power investments by region to 2050
Asia-Pacific also accounts now for about half of all Greenhouse Gas emissions, and in line with growing energy consumption, the growth rate of emissions from Asia, at over 3% p.a., is triple the growth rate of emissions of the rest of the world. Behind this high share of GHG emissions is not only overall energy consumption growth, but more importantly how much of electricity production in Asia is coal-fired. 67% of all coal-fired generation capacity is in Asia, and essentially all of the growth in new coal-fired capacity globally is in Asia. So as well-reported, Asia is the key battleground for future GHG emissions evolution, and for the scope of future climate change. How decisions are made about more coal, less coal, and the speed of adoption of renewable energy sources will have a disproportionate effect on the rest of the world and future generations.

Pakistan is a key player in Asia’s energy transition, albeit one drawing far less attention than China and India. This is somewhat surprising, given that Pakistan is the world’s 6th most populous country, with about 200 million people. Pakistan also has plans for larger investment levels in new power capacity than all but a handful of countries, and some plans to increase coal-fired electricity production by over 500%… so an important country on many fronts! Let’s look more closely at the state of play.

For a country with as many people as Pakistan, and which has recorded solid economic growth for decades, power production is remarkably low. Total generation capacity today in the country is only just over 25 Gigawatts (GWs), and per capita electricity consumption is only 2/3 of that in India, and only 1/3 of that in Egypt. While 90 million people have gained access to formal electricity over the last two decades, there are still some 50 million people without access, and industry is hampered by extensive load-shedding, often over 10 hours a day. Thus increasing power availability has been a high government priority in Pakistan for a long time, and one can expect that the country will add substantial new production capacity over the next couple of decades.

Pakistan’s power sector is of high importance – for provision of basic services, supporting economic and job growth, and for public finances. It also has some oddities. One is the unusually high share of oil-fired generation: about 1/3 of Pakistan’s electricity is produced from either diesel or fuel oil, probably the highest ratio – by far – of any of the world’s largest countries. This has had and continues to have major negative consequences in terms of higher costs, high GHG and particulate emissions, and large trade deficits (Pakistan imports most of its oil). Hydropower and natural gas-fired generation each account for just under 30% of production, coal about 5% and nuclear a little less. Another oddity (shared with a small handful of its Asian neighbors) is the high percentage of power production which is government-run, at about 50%. A 2018 World Bank Report (“In the Dark”, World Bank 2018) estimated that these public sector plants use 17-28% more fuel per output than their private sector counterparts, and that mostly public policy and management inefficiencies in electricity cost the country 6.5% of GDP annually.

In the last five years, Pakistan has entered into a new energy transition, whose direction and outcomes remain very uncertain. The key energy policy decisions going forward for Pakistan revolve around its current transition, and the 20-30 GW of new electricity production capacity it seeks to add.

It has been clear to the Government that continued reliance on oil-fired generation is financially impossible. Yet between the choices of coal, gas, hydropower, wind and solar, the right direction has not been obvious. Development of more coal-fired capacity has had many supporters in Pakistan: the country has large domestic coal resources, coal has historically been a cheap source of fuel, and some government plans have called for coal to assume an up to 30% share of electricity production – compared to about 5% today. Domestic natural gas became important in the decades after independence, but domestic fields are essentially exhausted, and new imports of gas – while important – are at best replacing previous domestic sources, and are in part diverted to domestic fertilizer production. So the share of gas-fired power production is likely to decline substantially. Hydropower may be an important part of the solution. Pakistan has important developed and undeveloped hydropower potential. In the early decades after independence, large-scale dams were constructed by the country’s public sector utility: its chronic losses and mismanagement have essentially made further investment out of the question. Pakistan has instead turned to auctions, whose winners have to date been dominated by Chinese firms, notably China Three Gorges. This holds some promise of relatively low cost and low emission capacity growth, but contentious water ownership issues close to the border with India, climate-change related hydrological uncertainties, and the sheer scale of the new plants likely limit how big a role they play in overall country capacity growth. This leaves the key uncertainties of the transition between large-scale coal-fired generation increases, and accelerated development of wind and solar resources.

While not an early adopter, Pakistan has begun to replicate the renewable energy auction procurement mechanisms which have so strongly impacted many emerging markets. Roughly 40 new wind and solar farms have been provided PPAs, and at prices (US$0.05-0.07) well below Pakistan’s average power costs.

Pakistan power costs
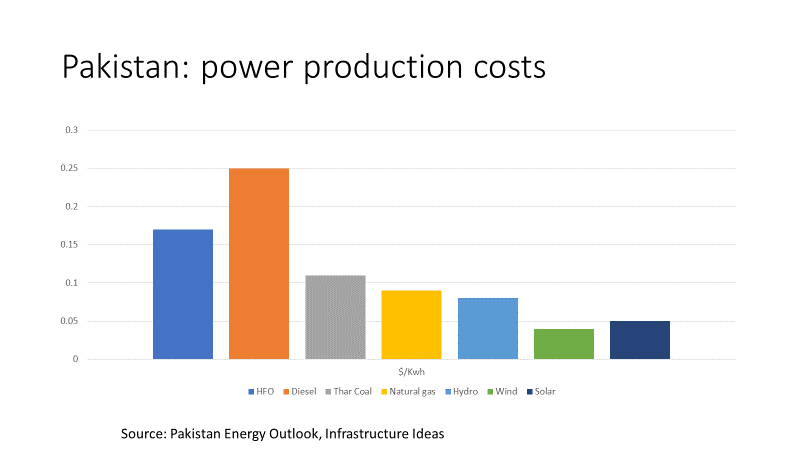
On the one hand, renewable energy is now the cheapest form of electricity generation in Pakistan. This should not be unexpected, given how falling costs have made wind and solar the cheapest options for new capacity in much of the world – accounting for over 50% of all new electricity capacity additions worldwide in 2017 – and Pakistan’s plentiful wind and solar resources. On the other hand, renewable energy proponents carry limited political weight in Pakistan. Proponents of expanded use of coal, by contrast, carry substantial weight – both domestic supporters who would like to see investment in local coal deposits such as the massive Thar field, and external financiers looking to sell coal and coal-fired generation plants – mainly from China. The Chief Minister of Sindh Province, where many of the country’s coal deposits lie, stated in early March that the long-delayed Thar coal-fired plant would “start soon.” Given Pakistan’s long-unstable domestic politics, and perennial foreign-exchange problems, the verdict on the country’s energy transition remains out. The implications are significant – building another 15-20 GW of coal-fired generation in Pakistan in the coming decades could add up to 100 million tons to annual CO2 emissions – an increase of 40% over Pakistan’s current CO2 emissions, and roughly what 25 million cars produce. And, given the contrary trends in prices, probably leave system-wide power costs at least 20% higher than they could be. This is clearly a country whose energy politics bear watching.

Some positive signs? In January, the 1,320 MW, the proposed Rahim Yar Khan imported coal-fired power plant was shelved, reportedly over concerns about increased fossil fuel imports. And in February, during a State visit, Saudi Arabia’s ACWA power, one of the largest wind and solar generation companies globally, was quoted as seeing the potential for up to $4 billion in investment in renewables in Pakistan.

EV Buses: the next big thing (maybe)

EV Buses: the next big thing (maybe)

Over the last two years, electric buses emerged as “the next big thing” in infrastructure for cities around the world. As noted by Infrastructure Ideas last year (“Notes from the Revolution: implications for infrastructure investors”), the market for electric buses has been developing even faster than the much-publicized market for electric cars. McKinsey calls this “the most successful electric vehicle segment,” with a 5-year sales growth rate of over 100%. Bloomberg New Energy Finance forecast, due to EV buses’ advantages in operating and maintenance costs and concerns over urban air quality in many mega-cities, that electric buses will capture as much as 84% of the new bus sales market as early as 2030. The European Commission has called for 75% of all buses to be electric by 2030.

For those readers who don’t ride buses, especially those in North America where e-buses are barely beginning to be introduced, this might look like a quaint but largely irrelevant sideshow. Yet this is already be a $50 billion dollar a year infrastructure market, and global investments in electric buses will likely be well over $1 trillion through the end of 2030. Not a market to sneeze at.

Yet as 2019 gets going, the prospects for EV have gotten cloudier. A lot of advantages and enthusiasm remains, but the experience of early adopting cities has also raised concerns to be addressed. Let’s see what is happening.

Over 100,000 electric buses were sold in 2018, costing between $300,000-$1 million each. Of those, over 85% were sold in China, which has a huge lead over the rest of the world in adoption and production to date. So the experience in China is by the far the deepest. But let’s begin with the more limited European and North American experience.

The experience to date with EV buses in the USA and Europe was summed up recently by City Lab’s Alon Levy in his column “The Verdict’s Still out on Electric Buses.”  EV buses have been shown to struggle when it’s too hot, too cold, or too hilly. Much of the issue has related to charging range, with for example Albuquerque finding that their new fleet – purchased from Chinese market-leader BYD – is showing a range of about 2/3 the contractually indicated range of 275 miles per charge. Most of the buses there ran on the city’s Central Avenue route, which features a large elevation change – consistent with the experience of Hong Kong, which also found that EV buses struggled on the hills there. Albuquerque has reportedly returned their buses to BYD. Phoenix, also in the Southwest, reported issues when temperatures hit Summer peaks over 100 Fahrenheit. Meanwhile cities in Minnesota and Massachusetts have found that EV bus charging range drops off significantly when temperatures drop to freezing or below. In Moscow, where Mayor Sergey Sobyanin has made a big push for electric buses, early experience indicates that roughly double the number of buses anticipated have been needed on routes run with EV buses, due to higher than planned time required to charge the buses.

If performance is problematic, and translates into higher – as opposed to lower – operating costs, this burgeoning new market may be in trouble. After all, like with other electric vehicles, EV buses still cost more to purchase than traditional diesel buses – up to 30% more. Notes of caution, as a result, are becoming more common across transit agencies.

China, as noted, now has much more experience with EV buses than North America – in fact, more experience than the rest of the world combined. How has this gone? The answer: much better, but to some extent the verdict is also still out.

Chinese cities such as Shanghai and Shenzhen have become world leaders in electric mass transit. A recent profile of the Shenzhen experience – where all 16,000 buses are now EVs — in The Guardian (“Shenzhen’s Silent Revolution: the world’s first all-electric bus fleet”) was extremely positive. Service levels have been satisfactory, annual CO2 emissions have been cut by nearly a million tons, air pollutants cut as well, and fuel expenses slashed. Because of the volume of the market, EV buses cost less than half (about $300,000) than they do in the US. Which still implies that Shenzhen has bought about $5 billion worth of buses. In the next two years, another 30 Chinese cities plan to achieve 100% electrified public transit, including Guangzhou and Nanjing. Yet a big piece of the success has been on the back of public subsidies. These subsidies make all sorts of sense in terms of public interest in China, with air pollution having been a major health and policy concern in many Chinese cities for years. But they are large – reportedly at around 50% of the capital cost of a bus, plus some operating cost support. These subsidies are due to lapse after 2020, so it will be interesting to see how the domestic market evolves subsequently. Investment in charging stations has also been substantial, with Shenzhen building around 40,000 charging points. And, as elsewhere, hilly terrain (Hong Kong) and cold (northern China) have negatively affected EV bus performance.

What to make of all this? EV buses, like most other disruptive technologies, will take some time to shake out issues. And the issues are real. Yet, it’s easy to forget that the early generations of wind turbines and solar farms failed to meet performance expectations, and experienced various teething problems. These problems haven’t prevented wind and solar from accounting for the vast majority of new electric capacity additions. And both charging technology and bus batteries are still evolving rapidly, with costs continuing to fall and capabilities improving. Perhaps some jurisdictions will decide that unusual conditions – cold, heat, or terrain – should make them late adopters, or hold-outs on EV buses altogether. And many cities will exercise some more caution in planning and procuring their next generation of public transit capacity, which is a good thing. In many Emerging Market cities, with substantial numbers of informal buses plying routes, transitions will take a lot of effort to manage. And it will take a lot of money, which cities will need to finance.

But in the end, EV buses are a superior technology, with rapidly declining costs, and that will be the determinant of the market. Cities will only face more demand for better air quality. Charging costs are far lower than diesel fuel costs. Technology advances and larger manufacturing scale will turn the current upfront cost disadvantage of EV buses into a large cost advantage over the coming decade. “Range anxiety” will find solutions, in improvements of both battery technology and convenience of charging. As for the reliance on subsidies, this is of course an important issue. Yet again the parallel with solar power generation is instructive: subsidies in early years raised production volumes, and accelerated the technology-driven decline in costs. In 2012/2013, for instance, an observer of solar power would have seen something similar to the EV bus market: an apparent reliance on subsidies driving volume, especially in China, and a 20-30% cost disadvantage over alternative technologies. Five years of cost declines later, the cost disadvantage has become a large cost advantage, and subsidies irrelevant. Hard to find reasons that the same story won’t play out with EV buses.

For cities, and for investors, a note of caution on EV buses is fine. Ignoring the coming of a $1 trillion market would be an expensive mistake. Not all cities will spend $5 billion on bus fleets like Shenzhen, but there an awful lot of big cities in the world. This will be a capital-intensive transition. Stay informed and up to date. The diesel bus is heading in the direction of the coal-fired power plant.

Renewable Energy as 2019 begins: Winners and Losers

Renewable Energy as 2019 begins: Winner and Losers

Renewable energy continued in 2018 as the largest segment of infrastructure financing globally. Utility-scale wind and solar, and rooftop solar new capacity installations grew again. The days of double-digit industry growth in capacity, however, seem to be past, and with falling costs the total capital going to renewables is clearly at a plateau. There’s good news and bad news for different parties, and in this column infrastructure ideas offers a guide to the winners and losers of the moment.

The numbers for 2018
Based on just-released figures from Bloomberg New Energy Finance, the fastest to estimate year-end numbers, “clean-energy investment” was down 8% from 2017, yet nonetheless, at $332 billion, over $300 billion for the fifth straight year. Within those numbers, investment in all segments were up except for two: small scale-hydro, and solar power generation – the latter seeming counter-intuitive but we’ll unpack it below. Onshore wind investment rose slightly, 2% to $101 billion, while offshore wind came into its own for the first time, recording $28 billion in investment. Bio-mass, waste-to-energy, biofuels and geothermal were all up from 2017, yet together accounting for only about 3% of total investment. Investment in solar, interestingly, fell from $160 billion to $131 billion. Two big factors seem to be have driven the plunge: one visible everywhere, with the cost per unit of new solar capacity continuing to fall be double-digits in 2018, and overall capacity installed still grew from 2017 though the costs of this declined; the other factor being visible mostly in China, where big policy changes led to a 32% fall in new renewables investment in the world’s largest solar market. India’s market, arguably the fastest-growing market in the world from 2015-2017 for new solar financings, also cooled off, with clean energy (mostly solar) financings falling from $13 billion to $11 billion.

Winners

1. Investors looking for RE assets. For investment funds and others who built up capacity to finance renewable energy, assets are increasingly there. The $300 billion in new financing in 2018 means renewables continue to be the biggest game in town, with over $2 trillion having been invested in these sectors in the past decade. And while the overall global market may have been slightly negative, the sharp slowdown in China obscures good growth outside of China: non-Chinese investment in wind and solar increased over 20%, and the non-Chinese share of the global RE market went from 45% to 60%. Given how relatively closed the Chinese market has been to external investment, this means the effective pool of investable RE assets has grown significantly.

2. Offshore wind in OECD. Offshore wind, a curiosity only a few years ago, is at $28 billion now the fourth largest segment of clean energy – after onshore wind, utility solar and rooftop solar. It dwarfs other clean energy segments such as geothermal, biomass and small hydro. For many infrastructure funds, offshore wind has another attraction: large average project size. So while there remain a limited number of offshore assets, and they are all limited to either OECD markets or China, this is clearly now a legitimate and important sub-market.

3. Policy-makers. The continued declines in the costs of solar, and to an extent onshore wind capacity, are great news for energy sector policy-makers. In particular, energy sector policy-makers in developing countries – whose task is to address insufficient power capacity and/or high-cost electricity systems – have now at their disposal the means to increase power availability and to sharply cut the average generation costs of power in their economies. Wind and solar power at below 6 to 7 cents a kilowatt/hour – or even below 3 cents are a number of markets are achieving – means new capacity at less than half the average tariff in many developing countries. And everywhere, policy-makers concerned over greenhouse gas emissions and looking to meet “green” policy mandates have well-established options for their electric systems.

4. Solar plus storage advocates. Not yet in the numbers but worth a flag. While new capacity of solar-plus-storage systems account for less than 1% of total 2018 investment, and does not show up in global clean energy numbers yet, one can see this is just around the corner. With energy storage costs plummeting as fast as solar panel costs did a decade ago, we are already beginning to see the first solar-plus-storage tenders emerge with costs competitive with or bettering the costs of new thermal power capacity. Look for this segment to be bigger than biofuels or geothermal within the next 1-2 years, and larger than the offshore wind segment within 5-10 years.

Losers

1. Investors looking for RE assets. If the big loser sounds like the big winner, that’s because they are one and the same. There are indeed more and more renewable energy assets available in which to invest, and a greater share of these is “market,” as the non-China share of this segment is where growth is concentrated. At the same time, though, price and risk of RE assets are an increasing concern for investors. Solar power-purchase agreements (PPAs) are increasingly being priced so low that making money has become an increasingly tricky proposition. Or put another way, the benefits of falling RE costs are being largely apportioned to consumers (and policy-makers), leaving thin margins to compensate providers of capital. And at the same time, many markets are seeing shorter PPAs being offered, meaning new solar and wind farms have shorter periods of guaranteed returns, and face the prospect of yet lower-priced competitors when the guaranteed-return periods come to an end. And more investors are coming late to the party, further pressuring returns. Assets are there for investors, but making good returns from them will require being smart.

2. China RE portfolios. If you had financed wind and solar assets in China during the past decade – and if those assets were not being curtailed by the Chinese grid (a big “if”) – things were not too bad through 2017. Not only has China been by far the world’s largest renewable energy market for several years, it’s also paid some of the highest prices for renewable-generated power through Feed-in Tariffs. The kind of wind and solar auctions which have been so effective at driving down the cost of new capacity in Brazil, India and South Africa, among other markets, have come late to China. But with the big policy changes enacted in 2018, China was more disrupted than any other market. Going forward it will be a new game, with China adopting the auction approach – post the 2018 disruptions, this is likely to be good news all around: cheaper RE power across China, increasingly competitive with existing coal-fired capacity and less likely to be curtailed. It will mean, however, a new approach to the Chinese market.

3. Thermal power. New RE capacity additions were more than double the roughly 70-80 GW of new thermal power capacity added worldwide in 2018. Even with the growth of natural-gas fired capacity in the US and China, thermal power is becoming a shrinking market for operators and investors. And this is with continued historically-low natural gas prices, in the $3-5 mmbtu range. Driving this shrinkage is the combination of declining cost-competitiveness of thermal power, as technology improvements are unable to drive down costs as fast they are declining in renewables and energy storage, and policy preferences in many markets. It’s not going to get any better, though natural gas – especially in combined-cycle plants, is increasingly outcompeting coal-fired generation.

4. Small hydro. In the days of early enthusiasm for renewables, hydropower enjoyed a boost in popularity, riding on the same wave propelling new technologies. Small run-of-the-river hydropower plants especially, seen as more environmentally-friendly than large dam-reliant hydropower, began to attract considerable interest from operators and investors. The 2018 numbers show that small hydro has been left far behind by its former renewable peers, wind and solar. At only $1.7 billion, about ½ of 1% of all clean energy investments, and one of the only categories declining in 2018, it looks like the lost stepchild.

5. Proponents of a 1.5-degree limit. For those concerned about climate change, and especially those wanting to see the world on a course to limit global warming to 1.5 degrees, 2018 was not a good year. Yes, renewable energy capacity is growing, and new investments are almost double those in fossil fuel-based power generation. But even with this, the penetration level of renewables in the overall share of power generation is too low for a 1.5-degree warming scenario. Given that the rate of increase of renewable generation has slowed, it becomes harder to see climate mitigation efforts relying just on the economics of new generation facilities. So expect, therefore, both to see escalating effects of global warming – more extreme weather events, more calls for climate adaptation investments – and growing odds of a major discontinuity in energy policies down the road. One good bet: growing interest in funding decommissioning of fossil-fuel generation – watch this space for a forthcoming analysis of the topic.