Previous Posts

Infrastructure and Viruses — Part I

March 2020

This is the first of two Infrastructure Ideas columns about the effect of viruses on infrastructure. Today we cover an “old” virus (which would still have been seen as a kind of “new” virus until a month ago when COVID-19 came along): the cyber kind. The headline for this “old” virus? Same as the headline for the “new” virus. Watch out! Risks are growing, and systems risk getting overloaded – especially in lower-income countries. Our next column will turn to COVID-19 and some of its potential impacts.

Not so long ago, stories about cyberwar started with scary hypotheticals: What if state-sponsored hackers were to launch widespread attacks that blacked out entire cities? Crippled banks and froze ATMs across a country? Shut down shipping firms, oil refineries, and factories? Paralyzed airports and hospitals? Today, these scenarios are no longer hypotheticals: Every one of those events has now actually occurred. Incident by catastrophic incident, cyberwar has left the pages of overblown science fiction and the tabletops of Pentagon war games to become a reality.

The above excerpt comes from the 2019 “Wired Guide to Cyberwar,” written by Andy Greenberg, arguably the top authority among figures publicly writing on infrastructure cyber-risks. The story he tells begins with the attacks which first woke the infrastructure world to cyber-risks, the Fall 2015 disruptions of Ukraine’s national railway and Kiev airport which accompanied Russia’s annexation of Crimea, followed by the attacks on three Ukrainian regional energy utilities. This heralded a still-ongoing chain of cyberattacks. In 2016 the Ukrainian railway company lost its online booking system for days, and a power transmission station in Kiev was hit. This February, the US State Department issued a statement placing the blame for a series of October 2019 cyberattacks which disrupted television and internet services in Georgia on Russian military intelligence (Wired: the US Blames Russia’s GRU for Sweeping Cyberattacks in Georgia). The GRU center for Special Technology was also indicated as linked to the now-notorious “Sandworm” hacker group, responsible for the NotPetya worm which infected many infrastructure providers (most famously Maersk), as well as the malware which attacked the 2018 Winter Olympics.

For many infrastructure companies, these “Russian neighborhood” attacks have been discomforting while still seeming somehow fairly remote. But as several recent incidents have shown, cyber-risks for infrastructure companies across the world are becoming much less remote, and far more concerning. Three incidents in particular draw a worrisome picture:

1. In October 2019, reports indicated that malware had been found in a nuclear plant in India, the Tamil Nadu Kudankulam plant. This plant was not an old plant with outdated systems (as many nuclear plants around the world are today), but India’s newest and most sophisticated nuclear plant. This incident was worrisome not only because it indicated potential vulnerability of a nuclear plant, but because the malware seems to have originated from a group of hackers who previously (a) had shown no interest in infrastructure, and (b) had shown little concern about damage they might create. This group, known as the “Lazarus Group,” is widely assumed to be controlled by North Korea. Among other things, it attacked Sony Pictures several years ago, stole some $80 million from Bangladesh’s Central Bank, and mounted the 2017 Wannacry ransomware attack. That such a group was apparently able to infiltrate not just any infrastructure facility, but a nuclear plant, is a major concern along many lines. The potential for either (1) the group itself seeking to extract large-scale “protection money” from targeted infrastructure facilities around the world, or (2) North Korea selling this ability to state or non-state actors in conflict zones, should be of major concern to infrastructure companies, and to governments.

kudankulam_nuclear_power_plant

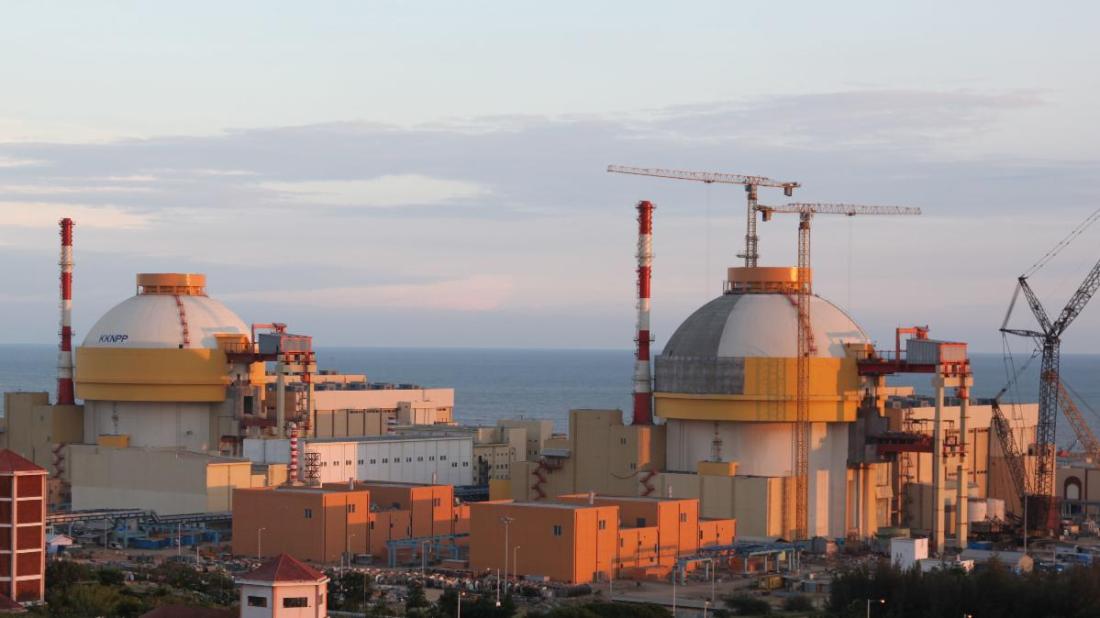
The Kundankulam Nuclear Plant

2. In October 2018, the Onslow Water and Sewer Authority became the second North Carolina utility hit by a cyberattack within a year. The utility chose not to pay ransom, and had to rebuild its entire information technology system. These two attacks in one US state demonstrated that as water infrastructure around the world modernizes, and becomes more connected in several ways to the internet, it has become more of a potential target for hackers. The New York Times reported that Syrian-linked hackers managed in 2016 to alter the amount of chemicals that went into a US water supply system, although no one was harmed. As the Times noted, damaging societies by attacking water supplies has a long history, but only now can it be done simply with keystrokes.

3. Last month, reports surfaced about a newly discovered piece of computer code named “EKANS.” This code appears to be targeted specifically at industrial control systems – something rarely seen before (only in the Stuxnet attack on Iranian nuclear centrifuges, and in the attack on the Ukrainian electric sector). Industrial control systems, well, control industries. Such systems operate both hardware and software in pretty much everything, including energy and infrastructure. EKANS seems to operate like other ransomware, freezing systems and access and locking-out administrators. Cybersecurity firms are particularly concerned that this malware seems not to originate from nation-state hackers, but from criminal networks. As one researcher commented, “it implies an increasing willingness and ability of non-state actors to significantly impact or impair critical infrastructure entities.” Earlier attacks sponsored by states already caused new concerns for infrastructure companies operating in countries located in geographies with conflict – Georgia and Ukraine are already examples, and it doesn’t take much imagination to be concerned about any infrastructure in the Middle East. Now if non-state actors can impact critical infrastructure systems, then infrastructure in any geography is at risk.

What to do? There are no sure-fire fixes. Hackers and cyber-security firms are in the classic arms race, with security firms striving to fix each new demonstrated vulnerability, and ideally minimize them before they are used, while hackers keep looking for new opportunities. Security though is a clear must. One of the surest ways for an infrastructure company to suffer the costs of a major cyberattack is to be completely unprepared. What the above should illustrate is the value of having a good security partner, to keep the risk as low as possible. Overdoing security can also have its costs – a number of infrastructure companies are reporting problems with the high volume of critical staff working for home during the current COVID-19 pandemic, as defenses aimed to keep hackers out of critical systems can make it difficult for large numbers of legitimate staff to do their work remotely. Where it can be done, build redundancy and back-up in case main systems become inoperative. And as the case of Maersk showed, even having one back-up computer which is not linked to the internet can come in very handy.

Infrastructure Ideas comments frequently about the impact of technology on infrastructure. As many columns have described, technology has made many infrastructure services cheaper and more accessible than ever before, and enabled unprecedently rapid progress in many areas. Yet as cyber vulnerability indicates, technology itself is neither good nor bad. What is for sure is that the impact of technology change is enormous.

Next Up: The Coronavirus and Infrastructure – Five Predictions

Money for Coal

March 2020

At least in Germany.

In October 2019, Infrastructure Ideas flagged a coming decommissioning wave for coal plants, and projected a future where coal-fired power plants are paid not to generate electricity, but to stop doing so. In January, that future arrived. As reported by the New York Times and others (How Hard Is It to Quit Coal? For Germany, 18 Years and $44 Billion), Germany approved on January 29 a plan to pay coal workers, companies, and producing states $44 Billion to close producing plants before the end of their technical life. Producing companies will receive $4.8 billion over the course of the next 15 years in compensation for shuttering their coal-burning plants, some of which will be replaced by natural gas-burning generators. The plan foresees taking 19 coal-burning power plants offline in the coming decade, beginning with the dirtiest plants later this year.

coal-exit-path-capacity-closures-felixmatthes1

This plan goes far beyond the one floated in Germany in the Fall of 2019 to use auctions to fix costs for early coal plant retirements. That plan had some attractive features, including the use of market mechanisms to reduce the cost of the program, but was judged to still leave too large a residual problem. In other words, Germany concluded that a voluntary program would leave too many coal-fired plants still operating, and they were willing to pay the cost of a mandatory one. That same dynamic is likely to play out at the larger global scale: market-based incentives, such as Germany’s reverse auctions, may well be a useful tool to begin the process of early coal-plant retirements; but mandatory, and negotiated, closures will be necessary – and probably on a much-larger scale than voluntary closures.

What can we learn from Germany’s experiment?

1. There is a lot of pressure from climate and environmental groups to take action against coal-fired electricity generation. Germany arguably has one of the largest concentrations of such groups, and it is not surprising that the first concrete plan should be found here. But that pressure can be expected to intensify and broaden geographically. German pressure was fueled in part by signs that the country was falling well short of its announced emission reduction targets (see McKinsey’s analysis on this topic). The same signs are apparent in much of the world.
2. Voluntary plans – the centerpiece of global climate negotiations to date, including the Paris Agreement – only take you so far. Mandatory plans for energy transition are needed to create impacts in line with climate objectives.
3. A forum that allows multiple voices to be heard – in this case the “German Coal Commission,” which worked for two years on crafting and negotiating an outcome that could be as widely supported as possible – plays a major role in crafting any “mandatory” agreement.
4. The technical costs involved with fast-tracking coal plant shutdowns are high, but not nearly as high as the costs of adjustment for workers and regions that have come to depend on coal for their livelihoods. In the case of Germany, a whopping 90% of the $44 billion plan is headed elsewhere than the generation companies who will be shuttering their plants.
5. The bill is high for putting in place a mandatory plan in a fair and consensual way. The German plan puts a price tag of around $1B per GW of coal-fired power retired.
6. For all its ambition and its hard-won consensus, the German plan may still wind up reopened. There are provisions for periodic domestic review of the plan and its execution. And there may well be international calls for speeding up the timetable, if global emission and warming projections worsen – which we believe they will. Either of these two could lead to higher costs than now contemplated for the plan.

Today Germany, tomorrow the world?

Aside from the German plan, there was related news in January that the European Union aims to create a €100 billion fund to aid the transition of Eastern European countries to cleaner fuels. This was a centerpiece of the much-discussed “European Green Deal.” The EU’s “Platform for Coal Regions in Transition” works similarly to the German Coal Commission, as a forum for working out details of transition and compensation for affected parties, to be embedded in a “Just Transition Mechanism”.

The details of the proposed EU plan illustrate an important additional lesson beyond that of Germany. Finding the money to finance this type of climate change-driven transition will be enormously complicated. While the overall envelope for funding envisaged is roughly in line with that of the German plan – about $1B per Gigawatt of generation capacity to be retired – the funding mechanics are very different. Whereas the $44B German plan simply call for payments from the state budget, the €100B EU plan calls for only €7.5 of direct EU funding, to be leveraged by loans (some from the EIB), national budgets, and funds from yet-to-be-found investors. The basic principle of leverage is generally a good one – an early US state plan for retiring coal capacity, in Colorado, aims to manage associated costs by de-facto borrowing from ratepayers — but in this case sounds highly aspirational, and conveys a sense of considerable fragility in the future implementation of the EU plan. Just yesterday, the EU admitted it would take a “herculean effort” to make the plan work.

South Africa has also floated a “green plan” to shut down coal-generating capacity – if other countries will pay it to do so, as previously flagged by Infrastructure Ideas. However, the Government backed away from this idea in the October 2019 release of its next electricity “integrated resource plan,” keeping earlier blueprints for continued adding of coal-fired generation capacity. The dropping – for now – of the idea to sell Eskom’s loss-making coal fleet to “climate investors” has been ascribed to the inability to find a domestic political consensus, with Eskom’s unions reportedly leading the opposition. The plan now on the table leaves unaddressed the issue of Eskom’s near-bankrupt financial state and some $30B in debts, and so shares a high degree of aspirational thinking with the EU’s plan for Eastern Europe.

The pressure underlying these first “pay for coal” plans is going to increase, and increase rapidly. Coal-fired power generation continues to be the single largest emitter of greenhouse gases, accounting for 30% of all energy-related carbon dioxide emissions. In all climate models, phasing out coal from the electricity sector is the single most important step to get in line with holding global warming to 1.5 or even 2 degrees, and as time passes it is increasingly clear that canceling potential new coal plants will not be enough. The late 2019 report from Climate Analytics shows a need to go from current global coal-fired generation of 9,200 Terrawatt-hours all the way down to 2,000 TWH by 2030 – equivalent to decommissioning about 1,600 GW of generation capacity. Applying the cost of the German plan, $1B/GW, would imply costs on the order of $1.6 trillion to shut down this much global capacity.

We would expect such plans for fast-tracking of coal plant retirements – now that at least Germany there is a tangible model — to become the centerpiece of climate change discussions at the next COP summit, and to rapidly rise to the top of the agenda for multilaterals such as the World Bank. The experience of Germany, the EU, and South Africa points to a number of things we can expect for these discussions:

1. Forums that include bottom-up elements, and not just top-down planning, will be essential to the crafting of workable plans.
2. The bulk of any financing associated with these plans will be not for technical closing costs, but for worker and regional adjustment plans.
3. The financing amounts involved will be enormous. The $44B price tag for Germany’s plan is roughly equal to 4-5 years total generation sector investment, while the broad global estimated $1.6T price tag would be around 3 times annual global power generation investment.
4. Financing mechanics will be very complicated and contentious to devise. Germany’s financing approach – we’ll pay for it out of our own budget – is likely to be rare, if not unique. We can expect many false starts, and far more dead-end ideas than ones that get a serious hearing. Cross-regional and cross-country aspects will increase complexities (who will want to pay to retire China’s coal plants?). It may be a very long time before a workable solution for most, if not all, of the targeted retirement amounts is found – if it is found. The passage of time in finding viable financing mechanisms will mean emissions staying well-above aspirational climate targets, and in turn lead to a feedback loop where political pressure continues to build.
5. Financing for this energy transition ultimately will involve massive amounts of public financing, and that will mean a lot less public money available to invest in other infrastructure. Decommissioning coal-fired plants will become a massive competitor for infrastructure-related financing in the coming two decades.

Money for coal. It’s coming, and it won’t be easy. Stay tuned.

Renewable PPAs and Political risk: Spain revisited

Renewable PPAs and Political Risk: Spain Revisited
February 2020

In 2014, Spain – then Europe’s second-largest market for wind and solar electricity — shocked renewable investors and developers by retroactively and unilaterally revising the prices it paid for recently installed solar electricity farms. From a generous FIT (Feed-in-Tariff) system, Spain went to a “reasonable rate of return” approach, with far lower compensation to owners. This was a new kind of political risk coming to life. The outraged renewables industry hoped that either Spain would quickly change its mind, or quickly become so isolated from foreign investment that it would be forced to change its mind at least before long. Neither of the hoped-for paths materialized. Yet somehow, a few years later, in 2019, Spain returned to the forefront, drawing in over $8 billion of investment into new wind and solar generating capacity – more than any other country in Europe. What happened? And what have we learned?

Spain and solar

Since Spain’s 2014 decision to unilaterally change solar PPAs, arbitrators and lawyers have been busy. Some 50 cases arguing breach of contract – seeking redress on the order of $7 billion — have been making their way along in courts and arbitration processes. In 3 of the past 6 years, Spain has topped the list of offenders in the proceedings of ICSID — the International Center for Settlement of Investment Disputes, part of the World Bank Group. Spanish courts, unsurprisingly, have tended to support the government’s actions, while arbitration results have been for the most part going against it. About a dozen decisions have been rendered against Spain, with the current sum of awards at around $800 million. But Spain has yet to pay any of these awards out. Some of the ICSID arbitration decisions have sided with Spain, and in many cases awards have fallen far short of amounts being sought by investors (for example, SolEs Badajoz, whose case was decided in July 2019, was awarded Eur 41 million compared to a request for Eur 98 million). During the 2014-2018 period, investment in the Spanish electricity sector fell off considerably.

Then came 2019, and both the tariff and legal situation for the Spanish renewables sector changed. In November, Spain approved a royal decree floated earlier in the year which offers investors economic incentives that can only be accessed if the pending cases are dropped. The new law will allow investors to either stick with existing renumeration or opt to maintain a 7.39% rate of return for the next two regulatory periods, which ends in 2031. For Spanish players, this is cause for celebration: guaranteed income for 12 years, in exchange for giving up court cases which have not been going anywhere. Prior to the change, the then in force framework would have likely lowered existing tariff returns by about 40% at the start of 2020. For foreign investors pushing arbitration, the trade-off is less attractive (see Investors Still Waging War with Spain Over Retroactive Cuts), and many seem ready to continue to fight for compensation, though decisions remain to be announced. What was clear was the market reaction: new generation investment in Spain’s renewables soared, with the country overtaking Germany and the UK as Europe’s biggest market for 2019.

Clear winners in all this? Lawyers. And risk managers urging caution on investors. The main protagonists? The original investors – at least international investors, not the Spanish investors who can only sue through Spanish courts — may get some compensation, but much later than they’d hoped, and less than they hoped. Or they may not. Definitely not clear winners. Possibly clear losers, probably partly losers. The Spanish government saved a lot of money and hasn’t had to pay any of it back – yet. They may have to pay a chunk of it back soon. Or not. The economy slowed down for a few years, but it was doing that anyway due to the fiscal imbalances which led to the unilateral revisions in the first place, and now investment is back. And of course the current government is not the one who adopted the belligerent policy towards the renewables industry. Neither clear winners or losers, possibly partly winners (if they wind up paying very little of the) arbitration awards and requests, possibly partly losers (if they’re eventually forced to pay out large amounts).

So what to make of Spain’s highly-publicized breaking of contracts? In some ways, it may be surprising that more countries have not sought to follow Spain’s path. Leaving aside the specifics of Spain’s 2013-2014 budget problems which triggered the contract revisions, the underlying issue with solar contracts facing Spain at the time is one that is widely shared: technology improvement. When the price of a product falls a long way – as has been the case for wind and solar electricity – those who commit to buying the product on a long-term, fixed-price contract early wind up paying a lot more for the product than they would have if they had waited, and more than others who signed contracts later are doing. Spain is 2014 was paying anywhere from 30 to 50% more for solar power, with contracts signed in 2009-2010, than it would have been doing if it had signed those contracts in 2014, or than other countries then signing those contracts would be paying. The temptation for a buyer – in this case Spain — to find a way to get the new price, rather than the old price, is high. When the buyer is a new government, happy to cast blame on its predecessors, that temptation gets even higher. This has been the big political risk for renewables generation. But a great many countries have faced this temptation, and almost all have chosen to honor their old higher-priced contracts. The only similar attempt in recent years has come in the last year in Andhra Pradesh, where the incoming state government is seeking to force the lowering of tariffs – or cancellation – for 2-7-year-old solar projects contracted by the previous State Government. The new government, through the state-owned distribution companies, is seeking cuts up to 60% in agreed tariffs, and to cut 15 years off PPA lengths. A special case is in the offing in California, where the strength of renewable PPA offtake contracts are being tested in bankruptcy court – with the wildfire-driven bankruptcy of utility PG&E leading to attempts to shed various liabilities, including offtake contracts, to get PG&E out of bankrupcy. To date, California courts have affirmed the validity of the PPAs. Many eyes are on South Africa, whose situation today looks like that of Spain in 2014 taken to an extreme: a new government, an essentially bankrupt state-owned utility, large budget deficits, and renewable offtake contracts up to nine years old – several for power at well over $0.10 a kilowatt-hour, more than triple what new PPAs would be likely to cost. The Government of South Africa would love to change its older renewable energy offtake contracts, but so far has taken a different tack than Spain: it has offered project owners the option of voluntarily reducing the payments they receive per kilowatt-hour of electricity generated in return for longer deals and upgraded projects boasting more generation capacity.

Spain’s walking away from contracts was feared by renewable energy investors in 2014 to be the prelude to an epidemic. That has not happened. Political risk, even in the face of continued falling prices and widespread potential temptation, has remained low. The counterweight to the temptation, it can be argued, has been the source of the temptation itself. As wind and solar prices continue to fall – joined now by battery prices — and continue to present more opportunities for countries to reduce energy costs, staying in the market for technology is more important to most governments. In infrastructure, politics often trumps common sense. In renewable energy, technology is trumping politics.

The Desal Boom

February 2020

Thirsty world must wake up to water crisis,” runs one of an increasing number of headlines in recent years. According to the New York Times, 17 countries around the world are currently under extremely high water stress, while according to the Rockefeller Foundation, 1/3 of humanity and is water-stressed every year or season. Whether countries and/or regions are arid to begin with, whether aquifers are being overdrawn due to growing populations or economies, whether fresh water sources are being polluted, or whether climate change is making extreme weather patterns – drought or excess rainfall – more common, it is clear that the issue of water availability is affecting more people and more areas than ever before. The problem is getting worse, and the consequences are getting worse: the World Bank has written that climate change will be the biggest factor increasing the pressure on water supplies in the future, while former Nigerian Finance Minister Ngozi Okonjo-Iweala states that in 2017 water played a major role in conflict in at least 45 countries, particularly in North Africa and the Middle East.

water-desalination

In some places, desalination looks like the answer to this crisis. Desal is definitely booming: the number of plants around the world has quadrupled in the last three decades to over 20,000, and global desalination capacity in operation is up 500% since 2000. More than 300 million people around the world now get their water from desalination plants. As a recent review in Wired notes, for decades, the vague promise – since the first large-scale desal plants were built in the 1960s — that one day oceans of salt water would turn into fresh and quench the world’s thirst has not been matched by much reality. But now several factors have started to change the picture: on the supply side, the costs of desalination have been declining, dropping by more than 50% since 1990; on the demand side, with population booming in many water-stressed places, including big economies such as China, India, South Africa, and the American West, and droughts occurring more frequently, many more places need new solutions. Dry Saudi Arabia produces the most desalinated fresh water of anyone, a fifth of the world’s total, and desal makes up an estimated one-half of total water consumption in the Kingdom. Australia and Israel are also large producers. The industry has now seen somewhere over $300 billion in investments, with an estimated $15-20 billion in annual new capacity investment (author’s estimates).

Desalination demandJONES ET AL/ SCIENCE OF THE TOTAL ENVIRONMENT, 2019

Desalination plants have also become a favorite of many institutional investors. The large capital costs (California’s current wave of plants under construction run to around $750 million each, while Melbourne’s flagship plant was recently completed at a cost of over $3 billion). That level of capital plants makes water utilities more interested in finding private capital to help build projects, and in turn provides the large ticket size institutional investors look for in infrastructure assets – in this case along with stable revenues. In one example the Carlsbad, California, plant changed hands in 2019 from its private equity investors (Brookfield and Stonepeak) to Aberdeen Standard for over $1 billion.

What does the future look like?

In the near-term, current growth trends look likely to continue. California plans to double its capacity in the coming few years, and most of the places that are building new plants today will not see any improvement in their other sources of fresh water. For the industry, that’s good news. The longer term outlook is less clear. The market today is limited to where people are rich, and the cost of building desal plants, while it has come gradually down as producers move down the experience curve and plants get larger, remains prohibitive for low income countries – with no imminent technological breakthroughs on the horizon to produce the kind of plunging capital costs which telecommunications and renewable energy have experienced in the past few decades. Externalities are also significant – in terms of the high energy-intensity of the process and the toxicity of the brine produced, as noted in last October’s New York Times article on the topic — The World can make more water from desalination, but at what cost? And water, unlike electricity and data, remains difficult and expensive to transport over significant distances, limiting almost all consumption to relatively nearby to plants, and in turn sources of sea water. So while this has become a much larger and more attractive market than what is was at the end of last century, and water stresses will increase, we wouldn’t expect either a significant broadening of geographies turning to desalination, or double-digit annual growth rates in desalination going forward – maybe even a plateau in the level of new installations before long. Desalination infrastructure, while new to the party, will also face the same problem as much coastal infrastructure is beginning to face – sea level rise from climate change. As covered previously by Infrastructure Ideas, coastal cities are looking at big bills in the not-very-distant future for either protecting, or moving, infrastructure assets away from rising seas and increased flooding – and it is on these vulnerable coastlines that practically 100% of the world’s desalination plants sit.

The water crisis will continue to loom – and indeed to be present – for many parts of the globe in the coming decades. Desalination will help – expensively – in some places. The answers to the problem for many other places remain unclear, though there are examples of approaches worth following. An instructive example is Cape Town, which two years ago faced its widely-publicized “Day Zero” water crisis [infra ideas], but evaded disaster and got itself in a better position. Cape Town used a mix of water conservation and data management a(diverting some water from intensive agricultural users, a 30% reduction in municipal government use, and restricting car washing and the refilling of swimming pools), and some basic technology (a new water pressure system) – a set of tools in reach of many more water-stressed cities than desalination plants. Better water use and conservation – recycling wastewater, reservoirs, wetlands conservation – ultimately look like more economic and accessible solutions than desalination for much of the world. Inland desert cities – like Tucson and Pheonix in Arizona, pioneers in water conservation and management approaches – may be better models for the developing world than coastal California and Saudi Arabia. And one new technology may help more than desalination: a handful of utilities have begun to experiment with miniature submersible drones. Small underwater machines that are today mostly used as toys may not sound like a big deal – but equipped with GPS and cameras, these drones can help utilities locate water leaks at a tiny fraction of the cost, and in a tiny fraction of the time, of traditional methods – meaning less digging, faster repairs, and dramatically reduced water losses. That could be a very big deal.


Offshore Wind: The Next Big Thing

Offshore wind: The Next Big Thing
January 2020

Offshore wind has been beyond the horizon for energy planners everywhere but the North Sea, until the last few years. That’s no longer the case: offshore wind is becoming a major piece of the energy future for multiple countries and jurisdictions. Bloomberg reports offshore wind financings in 2019 came close to a whopping $30 billion, and in September 2019, the UK saw bids for offshore generation at under $0.05/KwH, cheaper than coal and natural gas alternatives. It’s a whole new water world out there.

Among the offshore wind projects reaching financial close in Q4 of 2019 alone were the 432MW Neart na Gaoithe array off the Scottish coast at $3.4 billion, the 376MW Formosa II Miaoli project off Taiwan at $2 billion and the 500MW Fuzhou Changle C installation in the East China Sea, at $1.5 billion. And in November Vattenfall was announced the winner of the Holland South Coast Phase II project, having already won Phase I; the 1.5 Gigawatt project will be Europe’s first subsidy-free offshore wind farm.

What happened? Only five years ago, offered prices for offshore wind tended around $0.15-0.20 a kilowatt-hour, well-above the price for competing sources and requiring government subsidies to proceed. Now larger and more efficient turbines, bigger projects, access to better offshore wind resources, and more developed supply chains have been driving prices down rapidly. Capex per MW of offshore wind capacity dropped from 4.5 Euros in 2015 to 2.5 Euros in 2018, a decline in costs of over 20% a year, according to Wind Europe. This has enabled the advantages of offshore turbines to come through: wind is much stronger off the coasts, and unlike wind over the continent, offshore breezes can be strong in the afternoon, matching the time when people are using the most electricity. Offshore turbines can also be located close to urban demand centers along the coasts, eliminating the need for new long-distance transmission lines

Offshore wind has already become the next big thing on the US East Coast. In November, New Jersey Governor Phil Murphy signed an executive order backing a goal of 7.5 GW of offshore wind by 2035, and said he expects that offshore wind could provide New Jersey with half of its electricity. Those figures would probably represent $15 billion of investment in New Jersey alone. In December, Connecticut awarded an 804 MW project with an (undisclosed) offset price “lower than any other publicly announced offshore wind project in North America,” expected to generate the equivalent of 14 percent of Connecticut’s total electricity supply. New York state announced in early January a 1 GW procurement of offshore wind in 2020, after 2019’s award of 1.7 GW of capacity, and announced a 9 GW offshore capacity target for 2035. And in early January Virginia’s Dominion Energy awarded a $7.8 billion, 2.64 GW offshore project – the largest currently on the drawing board in the US — to Siemens Gamesa.

The Land of Giants. With the average capital costs of offshore wind projects now easily in the $3-7 billion each range, the competitive landscape in the industry has evolved very differently than for the solar and onshore wind sectors. Solar in particular was characterized in its early days by many dozens of developers, at times trying to launch projects with capital costs of less than $50 million on a shoestring and selling them on to raise funding for their next investment. Not only are offshore wind turbines far larger than their onshore counterparts, but offshore wind players are far larger as well. The biggest current developers are Dong Energy in China, Scandinavians Ørsted (today’s market leader) and Vattenfall, and Iberdrola. All these have Balance Sheets with equity in the $100 billion-plus category. Vestas, Siemens Gamesa, and General Electric lead among turbine suppliers. An interesting sign of the times was the recent announcement from EDP of Portugal (itself partly owned by Three Gorges of China) and Engie that they would join forces in developing offshore wind projects, in order to gain the scale needed to compete.

Financing amounts are sufficiently forbidding that most developers have been financing projects on Balance Sheet, and until recently little commercial project finance debt has been available, outside of the policy banks in China for Chinese projects. The bulk of third-party financing for offshore wind has largely been in the form of ownership syndications and post-construction refinancing. The large scale of projects, while a major hurdle for many banks and smaller developers, is conversely an advantage for institutional investors such as pension funds and insurance companies, who have large minimum investment thresholds. These institutional investors have more typically invested in wind and solar through portfolio purchases rather than single project financing, as for example this week’s purchase of 50% of Total’s wind and solar portfolio by Caisse des Depots in France. From late 2018 European banks began to enter the UK offshore market with large amounts of non-recourse debt; as this model gains traction, it may allow smaller developers to become more active. As the sector is becoming more established, one can also expect the gradual development of a merchant risk-based financing model.

Offtake models have also been affected by the large scale of offshore wind developments. Corporate renewables, an increasingly big – and often well-priced – source of demand for solar and onshore wind projects, has not been a factor yet for offshore. In December, Ørsted announced the largest-ever corporate offshore wind deal, with German chemical company Covestro, for 100 MW.

What’s next? Tenders are planned in many countries, and are spreading beyond initial markets of Europe, the US and China. Vietnam, already with 99MW of offshore wind in place, is looking at what could become the world’s largest offshore wind farm with a capacity of 3,400 MW. ESMAP, a unit of the World Bank Group, published a study in October 2019 looking at eight non-OECD markets: Brazil, India, Morocco, the Philippines, South Africa, Sri Lanka, Turkey, and Vietnam. The ESMAP study estimated these eight markets alone have a technical capacity of over 3 Terrawatts – that’s 3,000 Gigawatts – for offshore wind. Globally, Wood Mackenzie expects 128 GW of offshore wind capacity to be built between 2020 and 2028, while Bloomberg New Energy Finance forecasts 188 GW of capacity to be installed by 2030. Those projections would imply capital investment in the sector in the range of $300 billion over the next decade. China is forecast to remain the largest country market, but with about half the global share that it has seen in solar (25% vs 50%).

Nonetheless, it may be difficult for offshore wind to gain more than a fraction of the geographic diversification that onshore wind, and particularly solar, have achieved. Many emerging markets are too small to consume the output of even a single offshore wind farm – at least in offshore’s current form. Construction timelines will also be an issue: an attraction of solar for lower-income, electricity-deficient countries is that solar farms can be financed and built fairly quickly, bringing new generation capacity on stream in a year or less after a country’s decision to proceed. An offshore wind farm typically takes five to ten years to develop. One possible model for smaller markets, for instance West Africa, might be multiple country offtakes.

A big factor in the longer-term development of offshore wind will be the feasibility – and cost – of floating wind farms. 99% of offshore wind farms to date are bottom-anchored, a big factor in the cost and scale of projects, and a limit on geographic deployment. Floating wind farms can in principle be deployed across many more areas, and could be built at a smaller scale. Indeed, the ESMAP emerging markets study puts 2/3 of identified potential offshore wind technical capacity in the floating, rather than fixed, category. IRENA’s late 2019 “Future of Wind” study forecasts floating platforms to make up a more modest 5-15% of total offshore capacity. Yet to date less than 50 MW of floating capacity is operational, so time will have to tell on this part of the technology. We’ll have to see how the winds blow…


Infrastructure in 2020: Ten Predictions

Infrastructure in 2020: ten predictions
January 2020

1. Wind and solar keep growing.

Growth in global renewable energy investment in 2018 and 2019 has been akin to the Sherlock Holmes tale of the curious incident of the dog that didn’t bark – there hasn’t been any. After a down year in 2018, global renewable energy investment stayed essentially flat at $282B in 2019, according to Bloomberg New Energy Finance (though still more than double BNEF’s estimate of investment in fossil fuel-based generation). Look for numbers to head back up in 2020, on the back of renewables’ cost advantages. In the US, the EIA forecast last week that wind and solar will make up three-quarters of new capacity additions in 2020, breaking previous records of annual capacity additions. The big variable for the coming year will be the largest renewable market in the world, China. The missing global renewable growth would have been there in 2018 and 2019 were it not for declines in China, whose $83B 2019 investment level was down for a second straight year, primarily in solar which is down 2/3 since its 2017 peak. As China transitions away from its Feed-in-Tariff mechanism for domestic solar generation towards competitive auctions, Infrastructure Ideas expects prices for new capacity to tumble, as they have everywhere else that auctions have taken hold, and growth in solar installations to resume in response. For Emerging Markets other than China and India, wind and solar investment rose 22% to a record $47.5 billion. In 2020, look for $300B in investment, a record 200 GW in new wind and solar capacity, and renewables as a share of net new generating capacity added worldwide to cross 70% for this first time.

2. Offshore wind is the new big thing

It looked like a curiosity for many years, but offshore wind is now breaking into the mainstream of electricity generation. Only five years ago, offered prices for offshore tended around $0.15-0.20 a kilowatt-hour, well-above the price for competing sources. But larger and more efficient turbines, bigger projects, access to better offshore wind resources, and more developed supply chains have been driving prices down. In September 2019, the UK saw bids for offshore generation at under $0.05/KwH, and now offshore is able to compete without subsidies in many markets. Bloomberg reports offshore wind financings in 2019 came close to a whopping $30 billion. Tenders are planned in many countries, and are spreading beyond initial markets of Europe, the US and China. Vietnam is looking at what could become the world’s largest offshore wind farm with a capacity of 3,400 MW. Look for many offshore wind headlines in 2020.

3. Challenges mount for power grids and utilities

Grid operators will continue to see a ramp-up of challenges associated with the energy transition in 2020. In developed markets, these challenges include continued switching to lower-cost generation sources, transmission, integrating storage, and integrating growing numbers of electric vehicles. The average EV traveling 100 miles uses as much power as the average US home does daily. California projects that EV’s will use over 5% of the state’s generation capacity by 2030. In developing markets with technically weaker grids, dealing with intermittency will be a bigger challenge, as well as integrating distributed generation and storage. Emerging Market cities may also create new demands as they start adopting electric buses in large volumes, the way we’ve seen in China. Large EV bus fleets will put significant pressure on charging infrastructure resources, while also offering potential storage solutions for urban utilities, especially as Vehicle-to-grid technology, or V2G, becomes more available. Look in 2020 for larger transmission investments in developed markets, and increasing concern in Emerging Markets – particularly those with state-owned grids – about how to modernize grids.

4. Non-lithium batteries get serious

As recently headlined in the Economist, Generating clean power is now relatively straightforward. Storing it is far trickier. Total investment in storage in 2019 came to around $5B, 99% in lithium-ion batteries. While this has been a major success, grids will need complements to lithium-ion technology soon. Though the cost of lithium-ion batteries is falling quickly, longer-term storage is likely beyond its practical capacity. Capacity to keep growing with solar and wind is also a question: the Institute for Sustainable Futures states that a world run fully on renewables would require 280% of the world’s lithium reserves, while concerns over sustainable sourcing of cobalt remain. Companies focused on longer-duration storage alternatives saw a major influx of investment in 2019, led by Energy Vault $110 million funding round, the single largest equity investment in a stationary storage company, according to Wood Mackenzie. Highview Power signed the first liquid air storage offtake deal, for 50MW in Vermont in December 2019. While 2020 project announcements with non-lithium batteries will remain small, look for them to make big headlines. And look for them to spread faster into smaller, low-income developing countries. The economics are more favorable in remote or island grids, where imported diesel creates a much-easier benchmark for storage to beat on price. Canada’s e-Zn targets remote communities that stand to benefit by offsetting diesel generator usage. NantEnergy, using zinc-air batteries has installed some 3,000 microgrids.

5. Green House Gas emissions: alarm keeps climbing, but no global agreements yet

One of our safest predictions. New studies and projections will continue to show climate change having a larger impact sooner than their predecessors. And politics, centered but not limited to the US, will again prevent significant concerted action to reduce emissions. The 2019 Madrid Summit was a glaring display of the stand-off. The only possible change for even 2021 here is the November election in the US.

6. Emissions-free city zones multiply

Though no global climate agreements are on the horizon, there is much climate policy activity at the local and national level: one big example is emissions-free city zones. This month, Barcelona opened southern Europe’s biggest low-emissions zone, covering the entire metropolitan area. Petrol-driven cars bought before 2000 and diesels older than 2006 are banned and face fines of up to €500 each time they enter the zone, which is monitored by 150 cameras. The new Spanish government is said to be planning low emission zones for all towns with over 50,000 residents. Whether driven by national or municipal authorities, we can expect to see such initiatives multiply rapidly, driven both by concerns over global climate inaction and over local air quality. Such zones now create opportunities for carmakers, though one can also expect to see EVs increasingly favored by such mandates, tilting the new opportunities towards EVs – and providers of EV infrastructure.

7. Unilateral “100% renewables” commitments multiply

Between frustration at the lack of global progress on reducing emissions, and the prospect of increasingly cost-competitive renewables and storage resources, a growing number of US states and utilities are setting targets for reliance on 100% clean energy. Thirteen US states, along with Puerto Rico and the District of Columbia, have now set 100% clean energy targets. Another four large states have announced plans to do so. Half-a-dozen large private-sector utilities have also committed to 100% clean energy targets, including famously coal-intensive Duke Energy. These mandates will continue to open new opportunities for renewable energy and storage providers, and importantly will likely offer less price-sensitive demand for longer-duration storage providers. The mandates will also start to impinge increasingly on natural gas demand for generation, and risk beginning to strand fossil-fuel generation capacity ahead of technical end-of-life timetables.

8. Financing premiums appear for climate risks

A big piece of news in the finance world last week was Blackrock’s announcement it would put in place a coal-exclusion policy. But even with Blackrock’s heft — it is the world’s largest investor in coal – this by itself is not a huge game-changer: not much new coal is going up in Blackrock’s geographies. Expect the bigger news in 2020 for infrastructure financing to instead be the appearance of the higher financial costs related to climate risks. In many ways it is shocking this has not happened yet, though a good piece of reporting from the New York Times last September pointed a finger at a big reason for the US. The Times reported that US banks are shielding themselves from climate change at taxpayers’ expense by shifting riskier mortgages — such as those in coastal areas — off their books and over to the federal government. Regulations governing Fannie Mae and Freddie Mac do not let them factor the added risk from natural disasters into their pricing, which means banks can offload mortgages in vulnerable areas without financial penalty. That cannot last without soon bankrupting the two biggest pieces of the US mortgage system (although it would be consistent for the Trump administration to prefer that option). The broader insurance industry is also suffering. According to Swiss Re, 2017 and 2018 were for insurers the most-expensive two-year period of natural catastrophes on record, most of them related to global warming. 2018’s most expensive insurance payout anywhere in the world was for the California Camp Fire. Fortune noted that new research shows that the wildfires of 2017 and 2018 alone wiped out a full quarter-century of the insurance industry’s profits. Unlike Fannie Mae and Freddie Mac, private insurance companies can react, and they will have to charge more to stay afloat. Expect 2020 to be the year that insurance prices begin to factor in climate-related catastrophe risks in a big way, and for that to begin flowing through to financing costs.

9. Delivery vehicles become the new EV focus

Electric car and bus sales volumes continue to grow, but expect electric vans to get a lot of the attention in 2020. Already in September 2019, Amazon placed a massive order for over 100,000 electric delivery vans – worth about $6B. The continued rocketing growth of the e-commerce delivery business, and the frequent use of diesel vehicles for delivery, make for an attractive and fast-growing market for electric vans. As noted by Wired, urban deliveries don’t require all that much range. Routes are predictable and plannable, and because the vehicles return at the end of every shift to a depot, recharging them is a breeze. Add the concerns of many cities about transport emissions, as noted above, and the attraction of the new market segment is easy to see. Now 2020 has started with a $110 million investment for Arrival, a UK start-up making electric delivery vans, from the combination of Hyundai and Kia. Arrival promises that its vehicles will be cheaper than their traditional, diesel-powered competitors, even without further declines in battery prices. Interestingly Arrival’s business model will also facilitate more rapid expansion to Emerging Markets than for makers of other EVs. Rather than building a huge new production plant, Arrival will work from “microfactories” that make only 10,000 or so vehicles a year, but sit closer to where their customers are, and making geographic expansion simple. Look for major changes in the logistics business in emerging country cities to flow from this soon.

10. More alarms over hacking of infrastructure

Many new opportunities are opening for infrastructure investment. Yet risks are growing as well. The hacking of Ukrainian energy company Burisma late in 2019 by the Russian military was clearly politically motivated. Hacking capabilities continue to grow far faster than defenses. Look for more widely-publicized attacks on infrastructure assets in 2020.


2019 in Review

Infrastructure: 2019 in Review
January 2020

In January 2019, Infrastructure Ideas made 10 predictions for 2019. With the year closed, it’s time to take a look at how things unfolded. And twelve months later, the world looks a lot like we expected it to: of Infrastructure Ideas’ 10 predictions for 2019, 7 hit the mark, one came close, and two were premature. Essentially identical to our track record for the same exercise in 2018. All in all, a continued year of change in the world of infrastructure.

Here were seven predictions on the mark:

1. Wind and solar power keep growing and getting cheaper… and lagging aspirations. The march of “world-record pricing” had slowed in 2018, but picked back up in 2019. In Brazil and Portugal, solar auctions netted new PPA commitments of 1.7 US cents per kilowatt/hour, bringing the threshold for new solar power availability down below two cents for the first time. The “record” price for solar power at the beginning of last decade? 34 cents. By 2019 solar price records have fallen no less than 95%. Sounds like a lot to us. The record price now for wind PPAs? Even lower — 1.1 cents per kilowatt/hour. Solar and wind each will have seen over $1 Trillion in investment over the last decade, clean energy accounted for over 40% of electricity production in both Germany and the US in 2019, while solar and wind accounted for some 50% of all new power investment in the US in 2019. China’s cumulative investment in wind and solar capacity now exceeds 2,000 GW. Yet while cheaper renewables continue to be the “new normal,” the decline in worldwide greenhouse gas emissions also continues to look far off what is needed to slow global warming. So we expect the underlying pressure to “do more” (read, accelerate the retirement of existing fossil-fuel fired electricity plants) to continue to build.

Wind Farm in Nebraska

2. New records in energy storage. We said this was the easiest of all 2019 predictions, and so it proved to be. Bid prices for combined solar generation plus four-hour storage in a pair of US states came in below $0.04/KwH, roughly half the record of 3 years ago, and half the cost of greenfield coal power generation. Largest electricity storage projects jumped from 100 MW to 700 MW, with a number of projects around 400 MW. Our September column, Checking in on Energy Storage costs, goes into more detail on the trend.
3. Intensified pressure on coal-fired plants. Production of coal in the US in 2019 fell to its lowest level in 40 years. Many of the largest industry players are in bankruptcy. Worldwide the number of completed coal plants has fallen by half since 2015. Coal-fired generation costs are either steady or rising, depending on the market, while prices of alternatives keep tumbling. Political pressure, in spite of the Trump administration, will continue to get worse as concerns over climate grow. See our October series on coal for more on this (What next for coal, The Coming Decommissioning Wave, and Blue Coal ?).

Shuttered coal plant - West Virginia
Shuttered Coal Plant, West Virginia

4. Urban infrastructure keeps center stage. 2019 saw continued large investments in new mobility technologies. IPOs by Uber and Lyft held the headlines, while McKinsey noted that micro-mobility investments have exceeded $100 billion in the past two years (see Start Me Up: Where Mobility Investments are Going).
5. Charging infrastructure starts to mature. The global population of battery-powered passenger cars on the roads passed 5 million last year, keeping up with its 50% annual growth rate since 2013. EV support infrastructure has grown alongside: venture investments in EV infrastructure companies totaled $1.7 billion from 2010 through the first half of 2019. ChargePoint today operates the largest network of public chargers, with more than 99,000 units in the fleet. A big turning point in 2019 was, however, in business models for charging infrastructure. Tesla rolled out its “Supercharger network,” essentially marketing EV charging as extensive and simple and so helping to overcome many buyers’ concerns about the hassles of recharging. In November, Ford followed suit and announced it will provide customers with two years of free access to an app called the FordPass Charging Network, which will include expedited use of “more than 12,000 charging stations with more than 35,000 plugs.” Ford is teaming with Electrify America, which has a fast-growing network, and with Greenlots (owned by Shell), which is developing and mapping EV charging stations. Ford is partnering as well with Amazon to offer installation of at-home charging outlets, again seeking to simplify installation of home charging infrastructure. With these moves, we can expect investment in EV charging infrastructure to continue accelerating, as EV ownership reaches critical mass to make these investments pay off.

Tesla Supercharger station

6. Buses outdraw subways. Subway system projects worldwide continued to struggle. Washington DC’s Silver Line extension is now at least 18 months in arrears. The generally successful Santiago, Chile, subway needs major repairs to stations which were damaged in the 2019 wave of protests. Asia has accounted for 90% of planned subway investments, and trends there are clear. China, where the largest number of new systems has been concentrated in the past two decades, has cut back on new projects. Jakarta was one of the few cities managing to open a new system (three decades in the planning), while Manila’s long-delayed first subway is finally nearing its operational debut. In contrast, investments in new bus lines and systems continues to be strong, whether in BRT (Bus Rapid Transit) or electrification. The world’s largest transport market, China, continues to pour significant funding into buses while it cuts back on new subway projects (see February’s EV Buses column). The continued message for urban transport planning: bus systems are getting cleaner and cheaper, and most importantly are far less prone to the major cost overruns and delays associated with subway construction.
7. A lot of talk will stay talk, not action. We weren’t expecting a US infrastructure plan, infrastructure policy reforms in major emerging markets like Argentina, Indonesia, Nigeria, or South Africa, or a major international accord on climate change regulation. We didn’t get them.

One Infrastructure Ideas prediction was sort of in line, but not entirely on the mark. This was our prediction of 2019 as The year of climate lawsuits. 2019 did indeed see landmark climate-related lawsuits, including the high-profile US Supreme Court decision in December that Exxon did not commit fraud in misleading investors on climate change. PG&E, one of the largest US utilities, was forced into bankruptcy due to attributed responsibility in California’s wildfire epidemic (see our column The PG&E Bankruptcy, from January). Nine US cities and counties have lawsuits in process against fossil fuel companies, and a variety of additional class action and individual lawsuits are percolating. But none of the legal challenges have yet resulted in a “tobacco” style judgment, or crippling liabilities and fines beyond the special case of PG&E. But it feels like attempting to hold back the tide.

Two predictions for 2019 have proven premature.
Hydropower starts to take on water. Hydropower continues to have significant support from climate change campaigners, as a means of reducing fossil fuel emissions. Large hydropower projects also continue to attract significant criticism on environmental and social grounds. Macedonia, Guatemala, Russia and Laos have all cancelled major planned hydropower projects in the last two years, essentially on E&S grounds. But the coming game-changer for hydropower is neither of these, and instead is technology change – or the lack of it. Large hydropower projects are complex and often problematic, and their costs are increasing or at best steady – while the costs of alternative technologies (natural gas, solar and wind) are falling rapidly. We continue to expect large hydropower projects to begin to be abandoned on economic grounds, though we are not yet seeing it.
New technology comes to water. The energy and transportation sectors have been heavily disrupted by new technology over the last decade. Change is coming to water: the combination of nanotechnology and drones will make possible a massive improvement in the ability of water utilities to find and fix leaky pipes in their hundreds of miles of underground pipes. The movement was not yet large-scale in 2019, but can be expected to be so before long.

Coming up next: our ten infrastructure predictions for the year ahead in 2020.

Airports, Ports and Climate Change (II)

Airports, Ports, and Climate Change (part 2)
December 2019

NavClimateLogoHiResSquare-320x245_c

This is the second in a two-part Infrastructure Ideas series on the effects of climate change on infrastructure transport facilities, following part 1 on airports. This post will survey climate change impacts on ports around the world.

Over 3700 maritime ports and their supply chains enable global and local commerce, helping the over 90% of the world’s freight that moves by sea. Ships make on average some 3 million landings a year at ports around the world. One study found that ports and ships account for as much as one-quarter of the GDP of the United States, contributing over $5 trillion to the US economy alone. All of these ports are, by definition (leaving out “dry ports” which have their own importance in logistics chains) located by water. As climate change accelerates, and waters rise, all of these ports will be affected by a range of consequences, some of them expensive.

The EU’s Joint Research Center projects that by 2030 64% of all seaports are expected to be inundated by sea level rise, due to the combined effects of tides, waves, and storm surges. The number of ports that face the risk of inundation in 2080 is expected to increase further by 80% to 2080. While various climate change projections may have considerable uncertainty, depending on the combination of how much higher carbon dioxide atmospheric concentrations get (uncertain because possible future emission trajectories are all over the place) and of feedback loops (on which key pieces of the science remain untested), two things are very clear: (1) sea levels will rise, and (2) they will rise more in some places than others. In Europe, it is forecast that the North Sea (where 15% of total world cargo is handled), the Western part of the Baltic Sea, and parts of the British and French Atlantic coasts will see double the sea level rise of most of the rest Europe’s coastline. In the Black Sea and the Mediterranean, impacts from extreme high sea level are expected to be significantly milder, but also to occur more frequently. One analysis projects that once-in-a-century “extreme sea levels” will on average occur approximately every 11 years by 2050, and every 3 and 1 year by 2100 under more extreme warming scenarios. The analysis adds that “some regions are projected to experience an even higher increase in the frequency of occurrence of extreme events, most notably along the Mediterranean and the Black Sea, where the present day 100-year ESL is projected to occur several times a year.”

One might superficially think that rising water levels would, for seaports, be a matter of indifference, or even a plus. As opposed to airports, where airplanes affected by inundation become useless, ports are home to ships which float on top of the water – no matter how high the water is. Dredging might become less of a concern in some ports, and other ports may become less dependent on high tides for larger cargo ships to enter. But while it is no doubt true that climate change impacts will be more severe for airports than for ports, they will not be absent for port owners and operators. A 2011 case study published by the International Finance Corporation, on a port in Colombia, summarized well the issues, of which the two biggest are the storage and movement of goods, and multimodal connectivity inland from the port. Ships can keep floating as the waters rise, but containers of goods cannot. Spoilage risk can be expected to affect revenues in particular for ports handling grains and other perishables. The fairly small number of transshipment ports may not worry too much about inland connectivity, but the large majority of operators will be need to be concerned about impacts of high waters on infrastructure which they do not control – roads, and sometimes rail lines – in and out of the port to other parts of their region. A review of risks to Long Beach Port, one of the busiest in the world, notes that “in the next few decades, access roads could be covered in water; rail lines, either from heat or from ocean water inundation, would be unusable; electrified infrastructure such as cranes could stop working. The piers themselves, particularly older piers in the center of the sprawling 3,000-acre Long Beach complex, would be swallowed by sea and flood water, leaving them inaccessible to trains and trucks”. As the Colombia study also notes in passing, ports in developing and emerging markets may often also have unpaved areas which can be damaged more severely by inundations.

In this context, many ports face both pressure to participate in mitigation/ decarbonization efforts, and pressure to think ahead about adaptation. On mitigation, ome larger ports have had the luxury of trying to get on the front foot in the public debate. Seven ports — Hamburg, Barcelona, Antwerp, Los Angeles, Long Beach, Vancouver and Rotterdam – announced in September 2018 the creation of a “World Ports Climate Action Program,” aimed at working together to find ways to reduce CO2 emissions from maritime transport. Their program has five action areas:

1. Increase efficiency of supply chains using digital tools.
2. Advance policy approaches aimed at reducing emissions within larger geographical areas.
3. Accelerate development of in-port renewable power-to-ship solutions.
4. Accelerate the development of commercially viable sustainable low-carbon fuels for maritime transport and infrastructure for electrification of ship propulsion systems.
5. Accelerate efforts to fully decarbonize cargo-handling facilities in ports.

The Port of Oslo last month announced a 17-point climate-action plan, with the goal of becoming the world’s first zero-emissions port. The port produces 55,000 metric tons of greenhouse-gas emissions a year. By 2030, the port aims to make an 85% reduction in its emissions of carbon dioxide, sulphur oxide, nitrogen oxide, and particulate matter. The plan includes refitting ferry boats, implementing a low-carbon contracting process, and installing shore power, which would allow boats to cut their engines and plug into the grid when docked. Shore power can also power equipment like cranes, which normally run on diesel. Oslo incentivizes replacement of diesel with lower port fees and electricity costs to reward compliant ships, and by revising contracting processes to command terminal builders and shipping companies to obey low-emission rules. Rotterdam, which is Europe’s biggest port, is using zero-emission port equipment, while two months ago the Port of Los Angeles unveiled two new battery-electric top loaders.

Oslo’s plan is also of specific interest in that Oslo is a major port for ferries running across the Baltic straights; these ferries are estimated to be responsible for half the port’s emissions, a function of their frequency. Oslo has awarded a contract to Norled to electrify existing passenger ships; Norled delivered the first electric refit in September, and the ship now has the equivalent of 20 Tesla batteries on board. In a further sign of growing interest toward electrification among the industry, last month Washington State Ferries, which runs the second-largest ferry system in the world, announced it is switching from diesel to batteries. Washington State Ferries carry 25 million people a year across Puget Sound, and its annual fuel consumption is on par with that of a midsize airline, making it the state’s biggest diesel polluter. The ferry operator’s electrification program will start with the three most polluting vessels, which consume 5 million gallons of fuel a year between them; switching the three ships to fully electric operations would cut emissions by an estimated 48,000 metric tons of CO2 a year, the equivalent of taking 10,000 cars off the road. This will also require a major quayside electrification effort. Canada’s British Columbia Ferry Services, another major operator, moved to LNG some time ago and is now eyeing electrification of its fleet. This August also saw the launch of the world’s largest all-electric ferry to date, a 200-passenger, 30-car carrying vessel in Denmark, while in July the U.K. government announced that all new ships would have to be equipped with zero-emission technology.

On adaptation, almost all ports will need to take some sort of action to deal with rising waters, and more frequent extreme weather events bringing flooding. Key areas will be in protecting goods being stored and moved within ports, and inland transport connections. So far, the approach being taken by most ports is the obvious one – trying to keep water out of where it’s not wanted, and European ports are in the forefront. Rotterdam, Amsterdam and London are known to be protected against a 1 in 1000-year event, or at least what has been thought of as 1 in 1000-year events. Rotterdam’s measures are of the highest level globally, consisting of two of the largest storm surge barriers in the world. London’s flood barrier is also among the biggest in the world. These kinds of defenses do not come cheap. According to a recent study by consultancy Asia Research and Engagement (ARE), upgrading some of the 50 largest ports in the Asia-Pacific region to help cope with the effects of climate chance could cost up to $49 billion.

Future port adaptation measures are likely to be far more extensive than those implemented to date, and to require more varied technical approaches. Chances are pretty good, as estimates of how much and how soon sea levels will rise keep getting ratcheted up, that current forecast numbers for seawall-type protections will escalate quickly – as in the example of San Francisco’s barrier, whose projected cost jumped in a few years from $50m to over $500m. Chances are also pretty good that other complementary solutions will be needed, along the lines of major drainage improvements and ways to elevate storage facilities. Unless some radical positive change takes place, rising sea levels are likely to inexorably make seawalls regularly obsolete unless they too keep getting (expensively) raised, and solutions that focus more on the parts of ports that have to keep dry make be most cost-effective. Finally, chances are pretty good that new kinds of private-public partnerships for adaptation will be needed. Inland connecting infrastructure is more often owned by local governments that port operations are, and those governments struggle more than port operators to find revenues with which to fund raising and hardening that connecting infrastructure. Ports may find they need to help governments put in place the improvements to connecting infrastructure, without which ports will find their revenue streams drying up – all puns intended.

Airports, Ports, and Climate Change (part I)

Airports, Ports, and Climate Change (part 1)
December 2019

Last month, Denmark announced that Kangerlussuaq Airport — Greenland’s main airport — is set to end civilian flights within five years due to the melting of permafrost cracking its runway. Infrastructure investors take note – this is the first airport worldwide to close due to climate change, but unlikely to be the last. A new greenfield facility will have to be built to accommodate future flights.

A year earlier, Osaka’s Kansai International Airport was largely closed for 17 days, when waves and winds from Typhoon Jebi breached a seawall. In June 2017, American Airlines cancelled 40 flights out of Phoenix, Arizona, as extreme heat made it too difficult for smaller jets to takeoff from the airport.

Welcome to the future of airports.

Climate change is arriving, faster and worse than most projections estimated. For airport operators and investors, this will entail more of the type of consequences already being seen in Greenland, Japan, and Arizona. The current Infrastructure Ideas issue will outline some of these consequences, while the subsequent issue will examine the future of ports in a time of climate adaptation.

Emissions Mitigation. The world’s airlines are expected to fly over 4.5 billion passengers in 2019 (yes, almost a flight for every person on the planet), up by a billion since 2015. This high growth is driving very large capital investment plans for airports, as well as rising emissions. The aviation industry is estimated to be responsible for more than 850 million tons of CO2 emissions annually, about 3% of all global emissions. Emissions from jets are thought to have more harmful effects than many other sources of emissions, as they get released higher up in the atmosphere. Given air traffic projections, emissions from aviation are projected to triple by 2050. This has led in the past few years to increasing concerns, in the context of increasingly dire warnings from the scientific community about the pace and severity of climate change. Already in 2016 the International Civil Aviation Organization, ICAO, agreed to cap carbon emissions from international flights, starting in 2021 – an agreement which may prove difficult to implement if passenger growth continues as projected. Some airlines are also trying to get on the front foot: United Airlines announced a goal to cut its greenhouse gas emissions 50% by 2050. How this will be done, and whether it will be enough to offset the onset of major regulatory limits, remains to be seen. As start-up technology companies explore the launch of “air taxi” services, domestic flight emissions may also see accelerated growth. Industry players should expect that there is likely to be increased conflict between political emission reduction objectives on the one hand and unabated passenger growth on the other. Therefore investors in the sector may do well to factor the risk of political action either taxing flights and/or limiting flights, and therefore reducing the overall needs for capital investment in airport expansions. Arguments can also be seen already that controlling the expansion of airports themselves is an important tool to curbing airline emissions (see Curbed, Want to Get People to Fly Less? Stop Funding Airport Expansions).

Airports themselves emit a tiny fraction of the GHGs that airlines do – at least directly. Their own operations are far less likely to face political pressure of the type that airlines will. Nonetheless a climate neutral accreditation exists and has enrolled many facilities, whose efforts focus on meeting energy needs through renewables and improved efficiency, on the use of hybrid or electric vehicles, and on public/group transit facilitation for employees. Potential emission reductions of this type may be largest in airports located in lower-income countries, which often see a combination of less-modern/ less-efficient operational equipment and older less-fuel efficient aircraft. Jomo Kenyatta International Airport in Nairobi, for example, has achieved major GHG reductions by purchasing power units for parked aircraft which run on electricity, rather than diesel as the older units had. This is good — yet the indirect emissions related to airports are significant, and may prove to be more of a political target in the future. Indirect emissions would be mainly two elements: how many flights airport capacity allows, and transport emissions from people getting to and parking at an airport. As noted above, activism is beginning to target the issue of airport capacity expansions as a means of curbing airline emissions. It is likely that in the near future, the efficiency of passengers reaching an airport starts attracting attention, with arguments for parking expansions to be replaced by public transit, for example. At one level further removed, one can also anticipate growing pressure for investment in passenger rail services, coupled with increased taxation of short-haul flights, to attempt to shift traffic from air to rail for short-distance travel (as most fuel is burned on take-off and landing, making short flights more carbon-intensive flights). The bigger climate change worry for airports, however, is likely to be adaptation.

Adaptation needs: water. Water has gone from a friend of airports to a foe. In many cities, airports were built near seacoasts to minimize disturbances to humans or avoid natural obstacles like mountains. Now that water is rising, and airports are some of the most vulnerable infrastructure to sea level rise. In the USA, 13 of the country’s 47 largest airports have at least one runway that is vulnerable to storm surge, including the giant facilities in New York, Miami and San Francisco. Globally fifteen of the 50 busiest airports sit less than 30 feet above sea level, while the OECD identified 64 airports as likely to be affected by the predicted rise in sea levels. Complete disappearance of facilities may be remote (for the extreme risk, see our previous Lessons from the Venice Floods), but higher water levels will exacerbate the effects of storms, making airport flooding far more common and damaging. And though damage will be more extensive and long-lasting for coastal airports, inland airports will not be exempt from water-related adaptation issues. More intense rain events, another predicted effect of climate change, will cause more frequent and damaging river flooding, as the US Midwest has been experiencing. Inland airports are also frequently sited near rivers, for the same reasons that their coastal counterparts are frequently sited along the shore, increasing their vulnerability to flooding.

The obvious approach to adaptation for airports is to try to keep the water out. San Francisco is Exhibit A for this approach, having announced plans for a $587 million seawall to protect its airport. When the project was first tabled, in 2012, it was designed for an 11-inch sea level rise, with an estimated cost of $50 million. Seven years later, with climate projections getting worse, the revised plan now calls for planning on a 36-inch rise and has increased the estimated cost by 1,000%. Across the bay, Oakland plans a $46 million project to fortify and raise by 2 feet the 4.5-mile dike which protects it. In Hong Kong, plans for the $18 billion third airport runway were revised to include a 21-foot high seawall. Norway, whose state-run airport operator Avinor has called almost half its airports “quite exposed” to potential sea level rise, has decided to build all future runways at least 23 feet above sea level (For more, see this month’s article in Wired, How Airports are Protecting Themselves Against Rising Seas). Moving the water that does arrive is also critical: airport drainage systems will need significant fortifying to move greater and faster-arriving amounts of water. At some stage, however, airports will face the same dilemma that coastal cities and seaside home-owners increasingly face (see previous column, Capital Punishment): keep investing in barriers to the sea, or move. When city leaders opt to move, as in the case of Jakarta, it will be difficult for its airport to remain viable.

Adaptation needs: Heat. After water, the next biggest issue for airports will be extreme heat. The curbing of takeoffs due to 120-degree heat in Phoenix garnered many headlines (see the New York Times, Too Hot to Fly? Climate Change May Take a Toll on Air Travel). Hotter air means thinner air, impacting the ability of planes with smaller engines to generate enough lift to get airborne. Extreme heat requires longer distances to take off and/or reducing aircraft weight (with fewer passengers or cargo). Airports in locations where high temperatures already occur frequently, and with short runways that limit planes’ ability pick up speed, will be especially affected. One of Air India’s general managers, Captain Rajeev Bajpai, notes that extreme heat is already an aviation problem in countries like Kuwait, where planes can be grounded on summer days because their electronics automatically shut down. Hotter temperatures may cause tarmac to melt, or as in the case of Kangerlussuaq, may cause the ground under the tarmac to melt. While the impact of these issues may not rise to that caused by rising seas, takeoff and weight restrictions, and more frequent tarmac repairs, all add up to substantial costs for airport operators – as well as disruptions to passenger and cargo transport. Higher cooling costs will be another obvious effect.

There will be other climate adaptation needs. ICAO notes that high wind, heavy precipitation and even lightning strike events that threaten facilities, and aircraft are growing more frequent. But dealing with water and heat will be the big two for airports.

Financing Implications. Adapting to climate change will require greater capital spending from airports, accompanied by greater uncertainty and low likelihood of associated revenue gains. The airport industry is already today a major infrastructure investor. According to Reuters, $260 billion in airport infrastructure projects are under construction worldwide. Those are big numbers, and climate adaptation needs will add more, as we can see from the costs of just the San Francisco and Hong Kong plans. The handful of 30-million passenger per year airports will most easily finance and absorb these capital costs. Issues are likely, however, to arise for the larger number of mid-size airports around the world. The problem they will face is that the capital costs for keeping water out are related more to geography than the volume of an airport’s operations, and mid-size airports may face similar adaptation-related capital costs to those of larger airports, but without the same revenue base over which to amortize them. It will be an expensive asymmetry for many airports. The second financial implication of adaptation, greater uncertainty, is also illustrated by the case of San Francisco – where in seven years the projected capital needed to hold off rising waters rose by a factor of ten as projected sea rise levels kept changing. “It’s going to be an evolving battle,” as says Patti Clark, a former airport manager who now teaches at Embry-Riddle College of Aeronautics. Capital expenditures needed for continued operations in 2050 may well look very different in 2030 than it does in 2020. These kind of investments also have the disadvantage they will not in themselves produce incremental revenues – they will just try to keep the ship afloat, so to speak.

Harvey Houston Airport flooding

Houston Airport after Hurricane Harvey


Lessons from the Venice Floods

Lessons from the Venice Flood
November 2019

venice-floods-2164704

Venice is famous for its “high waters,” or Aqua Alta. The city has also been famously sinking in the past few decades. But even by its wet standards, early November has been remarkable – very unfortunately remarkable. On November 6, Venice saw its highest floodwaters since 1966: about six feet over normal high tide. Famous monuments such as La Fenice and St Mark’s were partly under water; the Aqua Alta bookstore, loved by tourists and Venetians for its habit of using bathtubs, plastic bins and even a gondola to display – and keep dry – part of its book collections, couldn’t stay above water. At the worst of it, water rose 10 inches in the span of 20 minutes. Even Venice’s one vineyard, home of the unique Doroma grape, was under threat. Then over the following week the floods returned… three times. It was the worst week of flooding in Venice since 1872, and at its peak floodwaters were the second highest ever recorded in the city. Thousand-year old St Mark’s has been previously flooded… five times. As this is written, the city remains flooded.

Unusual for sure. Notable for the fame of Venice and its monuments, visited by millions of tourists, for sure. A lesson in that more and worse flooding is coming to many famous waterside cities, as discussed in Infrastructure Ideas’ recent post on Jakarta (see Capital Punishment), again for sure. And also a lesson in what flooded Venice says about infrastructure and adaptation to climate change.

Increased flooding is already with us in many places (inland as well coastal, as reviewed in our earlier column “Floods and Infrastructure Investment”), and billions of dollars are already being spent trying to adapt. Many more billions are on the drawing board of infrastructure planners: this summer Wired reported the projected cost of protecting (just) US cities from sea level rise at over $400 Billion. Globally cost estimates are approaching the trillions of dollars.

A few things are already apparent from the billions being spent to attempt to stave off flooding. One lesson: flood barriers can be expensive – very, very expensive. New York City’s rebuilding of the Rockway Boardwalk after Hurricane Sandy cost $70 million per mile, and that was just for repairs. The Thames Barrier, in place since the 1980s to keep London dry, cost about $2 billion in today’s dollars to install. Venice – for here the story takes its major, intriguing, lesson-filled turn – yes, Venice, has spent billions to date on one of the biggest flood barriers in the world, “an underwater fortress of steel,” as the Washington Post called it. As reported by City Lab

What makes this round of destruction especially frustrating is that Venice’s massive flood defense system is almost complete. Costing almost $6.5 billion and under construction since 2003, the Venice Lagoon’s vast MOSE flood barrier is due to come into service in summer 2021. A string of 78 raiseable barriers threaded across the lagoon to block tidal surge, the MOSE project represent Venice’s moon-shot bid for survival in a warmed world.

Flood barriers are expensive. Venice’s experience also illustrates a second lesson for cities contemplating this kind of infrastructure investment: like other very large infrastructure construction projects, they take a long time to complete, and completion schedules only change in one direction. Venice’s barrier has been under construction 16 years: the original completion date was 2011, eight years ago. Had it been in schedule, Venice’s libraries, frescoes and squares would probably not be underwater today. When it will be available for use is unclear, and projected final costs reach as high $9 billion.

A third lesson is that, like with other major infrastructure construction, large amounts of funding may not wind up going where they are supposed to go. Venice’s previous mayor was arrested in 2014 and accused (never convicted) of siphoning off large amounts of money intended for the construction. A few months ago, before the floods, there were reports that sub-standard materials had been procured, and that repairs would be needed before the barrier was even used (a similar issue is currently plaguing the effort to extend the Washington DC Metrorail to Dulles Airport).

It would be good if the bad news ended there. But it doesn’t. The severity of this month’s flooding in Venice raises a fundamental question. After the billions, when the barrier is finally complete, how long will it last? A couple of decades?

Infrastructure planners and policy-makers in cities worldwide will be looking at many more billions of dollars in infrastructure spending to adapt to climate change-induced coastal flooding. Venice’s lessons indicate this infrastructure will require finding a lot of capital – some cities will find it, others will need to turn to national governments or the private sector, in public-private partnerships — to find the money. The lessons also indicate that planning, and construction, need to start sooner rather than later. Floods driven by sea-level rise and extreme weather events are rapidly increasing in frequency and severity, and every new projection shows problems coming sooner than the previous projections. Venice shows that flood barriers are not easy or quick to put in place. Venice also shows that spending controls and corruption prevention efforts will be important – with a lot of money comes a lot of temptation.

There are, of course, alternatives. Many cities are discovering the importance of smaller-budget “green infrastructure” efforts as part of their adaptation plans. Expanding rather than shrinking planted, permeable surfaces, preserving wetlands and other natural water catchment areas, green roofs and many other approaches can help reduce the incidence and impact of flooding. These approaches have the advantage of reducing the need for multi-billion dollar, probably delayed and more expensive than planned, possibly of rapid obsolescence, highly-engineered infrastructure investments. To a point. This would not have been likely to affect Venice’s situation much, though for certain cities the impact might be large.

And then there is moving. Indonesia is taking that route with Jakarta (sort of). Even culturally and historically important buildings sometime get moved. I once saw the Piva Monastery, in Montenegro: a 16th century church with remarkable frescoes, it was originally built in the valley of the Piva River, then relocated – stone by stone – in the 1970s during the construction of a reservoir for a hydroelectric complex. Adapting to flooding, in this case, intentional.